1. How do I fix compiler errors? or run time errors?
After installing Ubercode, use the Help - Index command to bring up the help file index.
Type in How to debug programs and click the Display button. This displays a help
topic with information on fixing most programming errors. The topic includes compiling programs
with debug information, fixing compiler errors (syntax errors), and fixing run time errors.
2. How do I use the debugger?
Recompile your program with debugging information and run it in the debugger. The easiest way of
doing this is by clicking the Run In Debugger button in the Developer Environment:
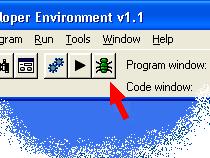
Clicking this icon re-compiles all necessary classes with full debug information and then starts
the debugger. When the debugger starts, it shows a window like this:
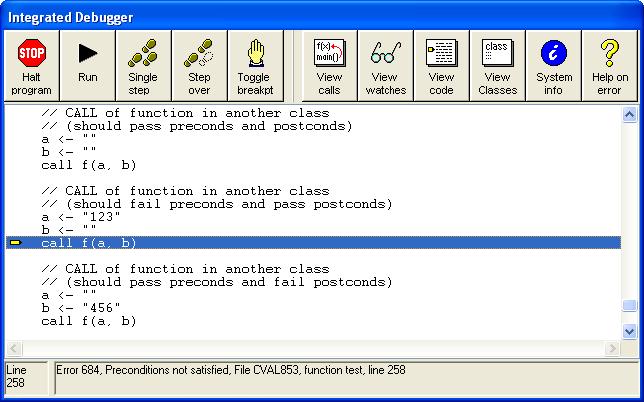
The debugger has the following commands available:
- Halt. Brings the program to an immediate halt.
- Run. Continues running the program to the end or until the next error occurs.
- Single Step. Runs the next program statement and returns to the debugger.
- Step Over. Runs the next program statement skipping over any function calls, and returns
to the debugger.
- Toggle breakpoint. Toggles a breakpoint at the current line of code.
- View Calls. Views the stack of function calls.
- View Watches. Views the values of all parameters and local variables.
- View Code. Returns to the current line of code in the debug window.
- View Classes. Shows all the classes in the program, classes can be double-clicked to
load them.
- System Info. Shows computer information such as the amount of free disk space and
memory.
- Help on Error. If there is a current error, this button shows a help page that describes
how to fix the error.
3. Why is the debugger putting breakpoints in the wrong places?
Normally the debugger only allows breakpoints on lines of code that correspond to generated
code, and it won't allow you to put breakpoints on comments or empty lines. If the debugger gets
the lines confused and wants to put breakpoints on empty lines or doesn't allow breakpoints on
proper lines of code, the debug information is out of synchronization with the source code. The
reasons are:
- Some classes were not compiled with full debug info or are not up to date. To fix this do a
full rebuild with full debug info.
- Incorrect line breaks in the source code. The compiler assumes each line of source code ends
with CR LF and it generates the debug line numbers on this basis. The debugger calculates its line
counts by looking for LF only, which is more efficient in loops as it searches for a single
character only, and is still correct as long as the lines are properly terminated. But if some
lines of source code are incorrectly terminated with LF only, the line break will be registered by
the debugger but not the compiler - this will cause the line counts to get out of sync. This
problem will only happen if part of the source code has been edited with a different editor that
uses LF on its own as a line break character. To fix the problem load the class using the Developer
Environment and save it. This will ensure all lines are terminated with CR NL as is required.
|